Research Question 2
Which types of ER visits are the costliest for total ER expenditures?
Objective
The research question is looking to explore the cost behind these ER expenditures. Moreso, it looks to see if large costs are associated with certain diagnostic tests, procedures, or medications provided during the emergency room visit.
Total cost is defined as the total, whole ER expenditures so costs to doctors, facilities, and even patients. This can help healthcare professionals allocate resources towards areas where there are high costs and make efforts in lowering costs without compromising quality of care.
- Dependent variable:
- Total Cost
- Independent variables:
- Diagnostic tests and procedures: MRI/CT, surgery, X-ray, lab tests, EKG, ultrasound, mammogram, vaccination, prescriptions, related condition
Data Visualization
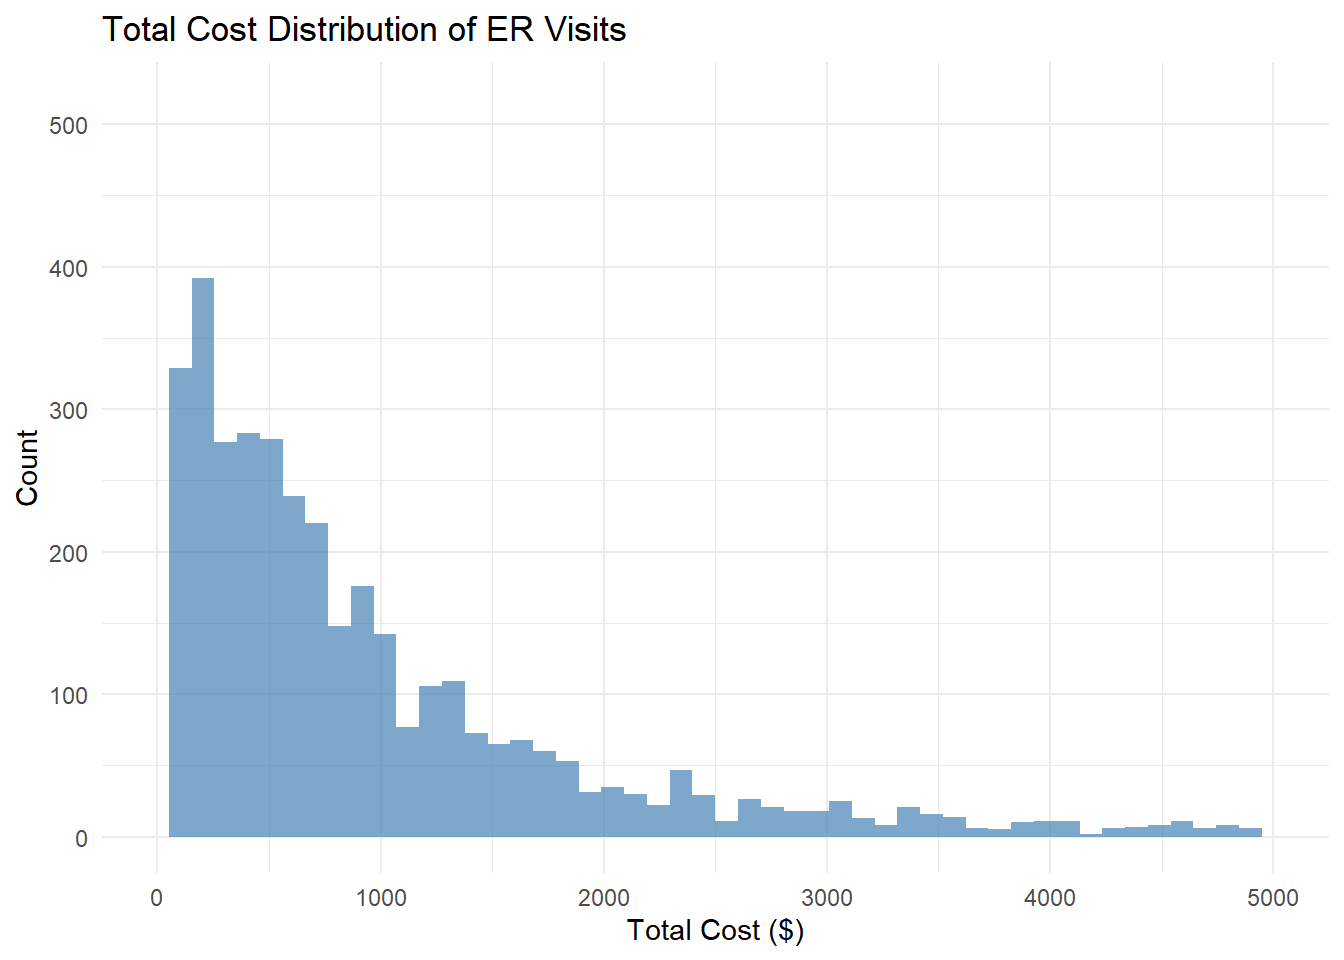
The boxplot shows the total cost of ER visits has a median of $578.20, a mean of $1,227.90, and a maximum of $195,314.50.”
Figure 1: Box Plot of Total Cost Distribution of ER Visits
This shows a left-skewed distribution of the total cost distribution of ER visits. There were also 367 cases with 0 costs, while there were 3874 cases with more than 0 out of pocket costs.
Figure 2: Left Skewed Distribution of Total Cost of ER Visits
Random Forest Model - Regression
The random forest model was chosen because it is able to rank important variables and can handle skewed data and outliers. The random forest model handles outliers by creating hundreds of random subsets of data within these random trees. Some of these outliers can impact a few trees, but overall it will not have a big effect on the predictions.
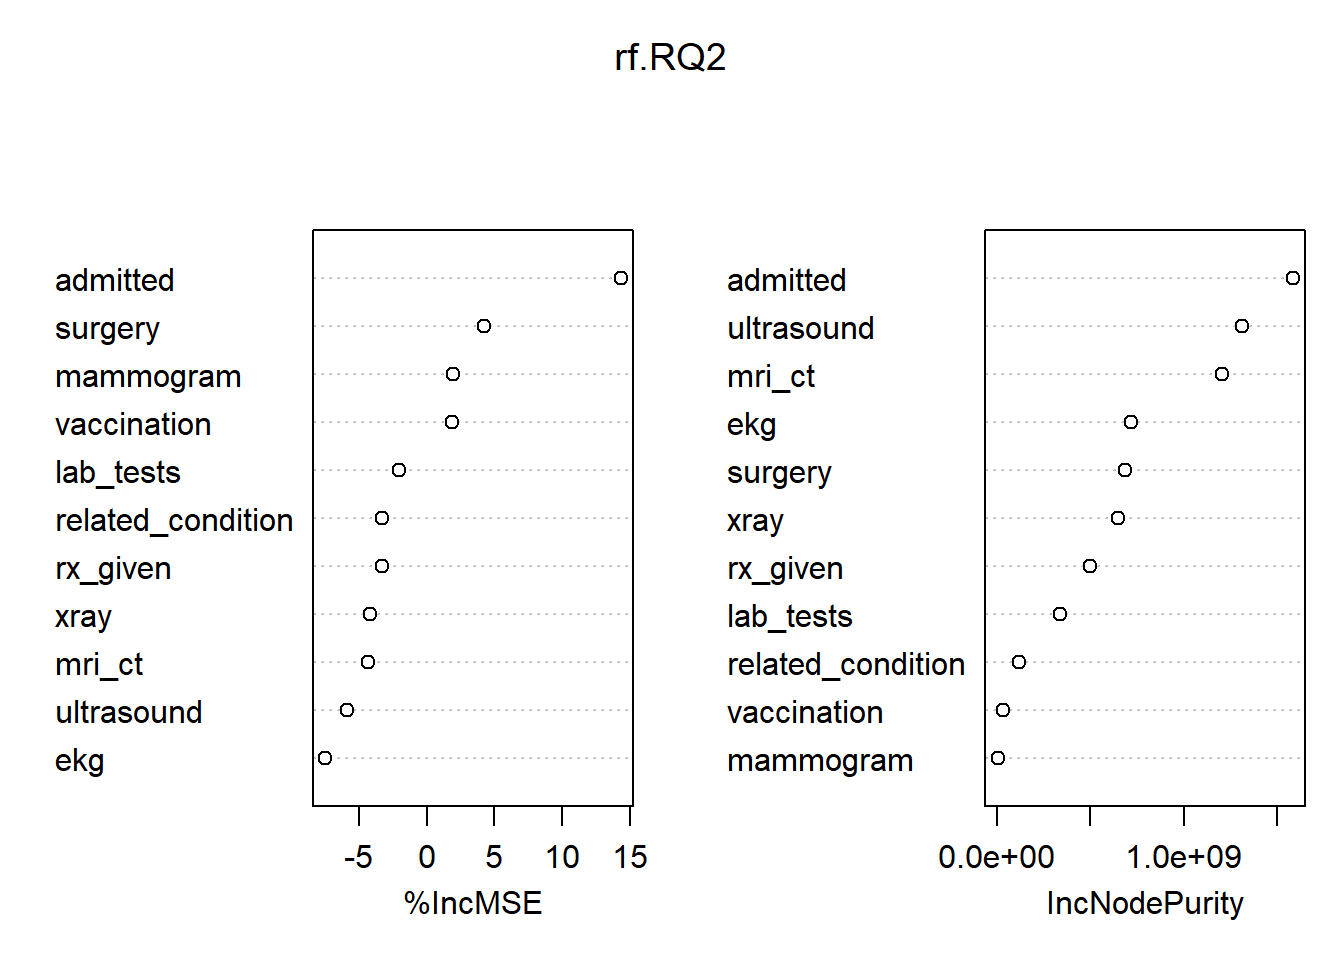
On the training data, the Random Forest showed a low percentage of variance explained and high mean squared residuals, mainly because the extreme outliers had a large impact. The metrics from the test set are more important because they show how well the model predicts data it hasn’t seen before. The strongest predictors for high ER total costs were patients who were admitted in patient and those who had surgery. The other variables had slight or no effects on ER costs. Random Forest model does not tell you the degree of negative or positive effect on ER costs.
Figure 3: Variable Importance Plot – Random Forest
Multiple Linear Regression
I performed a multiple linear regression once again on predicting total cost on the above variables in the Random Forest Model. Although the multiple linear regression can predict continuous variables, it cannot handle outliers very well. The results showed that patients who were admitted in patient was the strongest predictor in lower ER costs, this shows that there is a $1,589 decrease for patients who were admitted in patient. This may possibly be because the total cost is now outside of the ER visit, rather an inpatient cost. The second strongest predictor were patients who get an MRI CT have a $936.09 increase in ER costs, patients with ultrasound increase ER costs by $648, and patients with lab test increase ER costs by $336.39. We should also note that the EKG was close to the 0.05 p value at 0.06 barely making the cutoff, with a positive estimate at $384.07.
Key Insight: - Patients Admitted Inpatient show a $1,589 decrease in ER costs.
Key Insight: - MRI/CT scans were associated with a $936.09 increase in ER costs.
Key Insight: - Ultrasound and lab tests also contributed to higher costs, with increases of $648 and $336.39, respectively.
Key Insight: - EKG was borderline significant (p = 0.065) with a positive estimate of $384.07, suggesting a modest cost increase associated with EKGs.
These results highlight that procedures and diagnostics significantly influence ER costs, while inpatient admission may shift costs away from the ER.
Table 1 Multiple Linear Regression Ranked Coefficients from Strongest to Weakest
| Predictor | Estimate | Std. Error | t value | p-value |
|---|---|---|---|---|
| Admitted*** | -1589.18 | 201.76 | -7.877 | 4.68e-15 |
| mri_ct*** | 936.09 | 188.78 | 4.958 | 7.51e-07 |
| Ultrasound* | 648.08 | 251.73 | 2.574 | 0.010088 |
| lab_tests* | 336.39 | 169.31 | 1.987 | 0.047028 |
| Ekg | 384.07 | 208.61 | 1.841 | 0.065704 |
| surgery | 495.41 | 341.66 | 1.450 | 0.147165 |
| xray | 112.29 | 166.11 | 0.676 | 0.499099 |
| vaccination | -511.64 | 639.53 | -0.800 | 0.423760 |
| rx_given | -64.81 | 175.65 | -0.369 | 0.712158 |
| related_condition | 90.41 | 227.79 | 0.397 | 0.691458 |
| mammogram | -437.42 | 1901.22 | -0.230 | 0.818052 |
| (Intercept) | 867.75 | 227.04 | 3.822 | 0.000135 |
RQ2: Best Model – Random Forest
Referring to Table 4, the multiple linear regression model had an RMSE of $3,689.77, indicating that predicted ER costs differed from actual costs by roughly this amount on average. The MAE was $1,147.58, showing that predictions were about $1,147 away from the true ER cost. The R² value of 0.132 indicates that the model explains only 13.2% of the variation in ER costs, suggesting that linear regression is not well-suited for predicting ER costs in this dataset.
In comparison, the Random Forest model performed much better, with an RMSE of $997.89, an MAE of $243.08, and an R² of 0.97. This means that predictions were much closer to actual costs and that the model captured 97% of the variation in ER costs, making it a more reliable method for predicting total ER expenditures, especially given the presence of extreme outliers.
While linear regression provides precise estimates of how each predictor increases or decreases total costs, the Random Forest model does not indicate the direction of the predictors. But the Random Forest is a better model than the linear regression because it is able to handle outliers through their random trees. Extreme outliers in ER costs disproportionately affected the regression line, inflating errors and lowering R².
Table 2: Performance Metrics Comparisons: Random Forest & Multiple Linear Model
| Model | RMSE | MAE | R-Squared |
|---|---|---|---|
| Random Forest | 997.89 | 243.08 | 0.97 |
| Multiple Linear Model | 3689.77 | 1147.58 | 0.132 |