Research Question 1
What predictors can help determine whether an ER visit results in inpatient admission?
Objective
This research question focuses on identifying the factors that determine whether an ER visit leads to an inpatient hospital admission. While many patients are treated and released on the same day, some require longer stays for observation or additional care.
- Dependent variable:
- Inpatient admission
- Independent variables:
- Diagnostic tests and procedures: MRI/CT, surgery, X-ray, lab tests, EKG, ultrasound, mammogram, vaccination, prescriptions, related condition
- Insurance status
Understanding these factors can help healthcare providers plan more effective treatment strategies. Hospital administrators can also benefit from this information by predicting which patients may require extended care, supporting improved planning and resource management.
Data Visualization
Figure 1 illustrates that a smaller proportion of patients were admitted as inpatients v not admitted (21% v 79%). This highlights the skewed and imbalanced population, but this imbalance will be considered in the analysis.
Figure 1: Count of ER Visits by In Patient Admission Status
Logistic Regression
The logistic regression showed certain procedures—like MRI/CT scans, surgery, lab work, EKGs, ultrasounds, and having a related condition—were linked to higher odds of being admitted.
On the other hand, patients who had insurance or were given a prescription were less likely to be admitted (Figure 3). These two factors turned out to be the strongest predictors of lower inpatient admission.
Those with insurance have 88% lower odds of being admitted and those given a prescription have 73% lower odds of being admitted. Those who have lab tests have 128% higher odds of admission, patients with related conditions have 162% higher odds of admission, patients with EKGs done have 87% higher odds of admission, patients with surgery have 145% higher odds of admission, patients with ultrasound have 72% higher odds of admission, and patients with MRI CT scans have 53% higher odds of admission.
Key Insight: Patients with insurance have 88% lower odds of inpatient admission.
Key Insight: Patients who have had lab tests have 128% lower odds of inpatient admission.
Key Insight: Patients with surgery have 145% lower odds of inpatient admission.
Table 1. Logistic Regression Ranked Coefficients from Strongest to Weakest
| Predictor | Estimate | Std. Error | z-value | p-value |
|---|---|---|---|---|
| Insurance*** | -2.13319 | 0.11567 | 18.442 | < 2e-16 |
| rx_given*** | -1.30270 | 0.13127 | 9.924 | < 2e-16 |
| lab_tests*** | 0.82450 | 0.10913 | 7.555 | 4.19e-14 |
| related_condition*** | 0.96239 | 0.17494 | 5.501 | 3.77e-08 |
| ekg*** | 0.62813 | 0.11301 | 5.558 | 2.72e-08 |
| surgery*** | 0.89785 | 0.18537 | 4.844 | 1.28e-06 |
| ultrasound*** | 0.54345 | 0.13630 | 3.987 | 6.69e-05 |
| mri_ct*** | 0.42790 | 0.10906 | 3.924 | 8.72e-05 |
| Xray | -0.03592 | 0.10341 | 0.347 | 0.728 |
| Vaccination | -0.18130 | 0.48603 | 0.373 | 0.709 |
| Mammogram | -13.87172 | 238.18570 | 0.058 | 0.954 |
| (Intercept) | -1.09992 | 0.19147 | 5.744 | 9.22e-09 |
Table 2: Logistic Regression Confusion Matrix
| n=4241 | ||
|---|---|---|
| Prediction | Predicted No | Predicted Yes |
| Actual No | 647 | 124 |
| Actual Yes | 29 | 48 |
Table 2 shows the logistic regression confusion matrix, the true positive rate, the rate that correctly predicts those who will be admitted is 62.3% and true negative rate is 83.9%, the rate that correctly predicts who will not be admitted. The type 1 error, which falsely predicts patients being admitted when they are not actually admitted is 16.1% and the type 2 error which also falsely predicts patients not being admitted, when they are truly admitted is 37.7%. Overall, the model has ~82% accuracy rate
True positive rate (62.3%), true negative rate (83.9%), type 1 error (16.1%), and type 2 error (37.7%).
Random Forest Tree - Classification
The Random Forest model identifies the key factors that influence whether a patient is admitted. This classification approach works by generating hundreds of decision trees and aggregating their results to determine which predictors contribute most to the outcome.
The model used 362 trees to achieve the lowest mean squared error. The results showed that insurance coverage, lab tests, prescriptions given, and EKG were the most influential variables for predicting patient admission. In contrast, vaccination and mammogram variables contributed very little, like the findings from the logistic regression analysis. Figure 3 presents a plot showing the relative importance of each predictor in the Random Forest model. Table 3 presents the corresponding confusion matrix, showing an overall accuracy of approximately 82%.
Figure 3: Variable Importance Plot – Random Forest
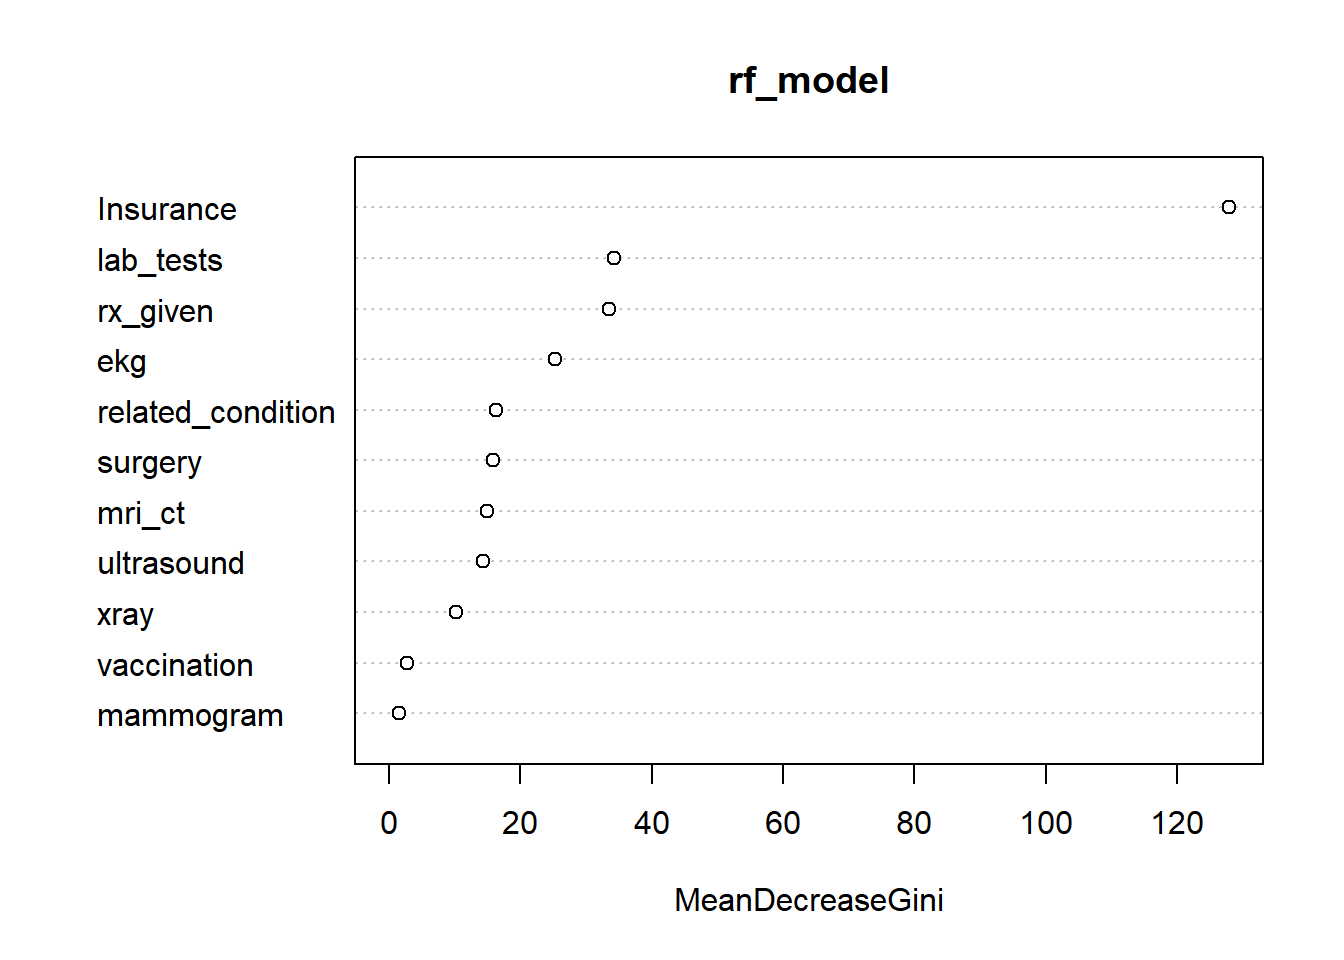
Table 3: Random Forest Confusion Matrix & Metrics
Accuracy: 81.7%, Sensitivity: 96.6%, Specificity: 23.3%
| n=4241 | Predicted No | Predicted Yes |
|---|---|---|
| Actual No | 653 | 132 |
| Actual Yes | 23 | 40 |
True positive rate (63.5%%), true negative rate (83.2%), type 1 error (16.8%), and type 2 error (36.5%).
RQ1 Best Model – Random Forest
The logistic regression and Random Forest models produced similar results, achieving roughly 82% accuracy. The logistic regression model offers greater interpretability, showing that insurance status and whether a prescription was given have negative coefficients. This makes it easier to understand the direction of these effects and how these factors relate to the likelihood of an ER visit resulting in inpatient admission.
The Random Forest model, however, is unable to provide this level of detail. However it does handle imbalanced data better because it builds hundreds of decision trees, each using a different subset of the data. While the two models have similar rates of accuracy, sensitivity, specificity, etc., the Random Forest’s approach allows it to more effectively capture patterns in the skewed admission data, which makes it a better model.